Low vision is vision loss that can’t be corrected even with glasses, contacts, medication,
or surgery. You might have some vision, but it’s hard to do everyday activities like
reading , driving or household chores. It’s more than needing glasses and can cause
disability.
Your doctor measures the clarity or sharpness of your vision, that is called visual acuity,
by how well you see at a distance of 20 feet. If you have 20/20 vision, you have normal
vision, which means you can see clearly from 20 feet away. If you have20/70 vision, it
means you must be as close as 20 feet to see what people with normal vision can see 70
feet away.
The complete low vision assessment involves:
History taking
Visual acuity
Refraction
Contrast sensitivity
Colour vision
Glare sensitivity
Visual field
History Taking
i. Cause of low vision
ii. The onset of vision loss(gradual/sudden)
iii. Status(stable/progressive)
iv. Medical,surgical and laser treatment
v. Family history: consanguinity,RP, myopia
vi. Age, educational status and professional requirements of patient.
vii. Is the patient taking medications that may impact their vision and can the patient
see to identify their medications?
Stages of adjustment of a patient with low vision are as follows:
Denial
Anger
Bargaining
Depression
acceptance
VISUAL ACUITY
Distance Acuity: It gives a baseline to monitor the pathology, but also helps to predict the
magnification level of the optical devices.
The most commonly used charts are:
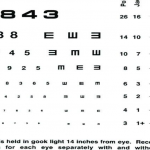
Bailey-lovie log MAR charts
Early treatment diabetic retinopathy
University of waterloo charts.
Log MAR chart.
Bailey-lovie log MAR charts
The charts come as a set of two panels (21×24 inches,
There are 14 rows with a range of sizes from 38 to 1.9 M
Sizes are given in snellen units for a 6
ETDRS Chart
The same number of letter per row (five letter per row)
Equal spacing of the rows and letters on a log scale ( the rows are separated by 0.1 Log
unit)
VISUAL ACUITY
It gives a baseline to monitor the pathology, but also helps to predict the
magnification level of the optical devices.
most commonly used charts are:
lovie log MAR charts.
treatment diabetic retinopathy study chart.
of waterloo charts.
MAR chart.
charts:
as a set of two panels (21×24 inches, 53x60cm)
are 14 rows with a range of sizes from 38 to 1.9 M-units)
are given in snellen units for a 6-meter viewing distance.
same number of letter per row (five letter per row)
spacing of the rows and letters on a log scale ( the rows are separated by 0.1 Log
It gives a baseline to monitor the pathology, but also helps to predict the
spacing of the rows and letters on a log scale ( the rows are separated by 0.1 Log
NEAR VISION:
The purpose in testing near vision is to determine how people can cope with near tasks.
The results of a near vision test show a person’s ability to see the details of near objects. The results
of the test will give an idea of the detail that can be discriminated. Near tasks include crafts and leisure
activities, eating, personal care and hygiene, writing and reading.
NEAR VISION RECORDING
Near vision is recorded with presbyobic correction worn (in case of presbyobic patient and visual acuity
chart held at 40 cm (16 inches), both monocular and binocularly. For a non presbyobic patient record
visual acuity with the best corrected distance glasses.
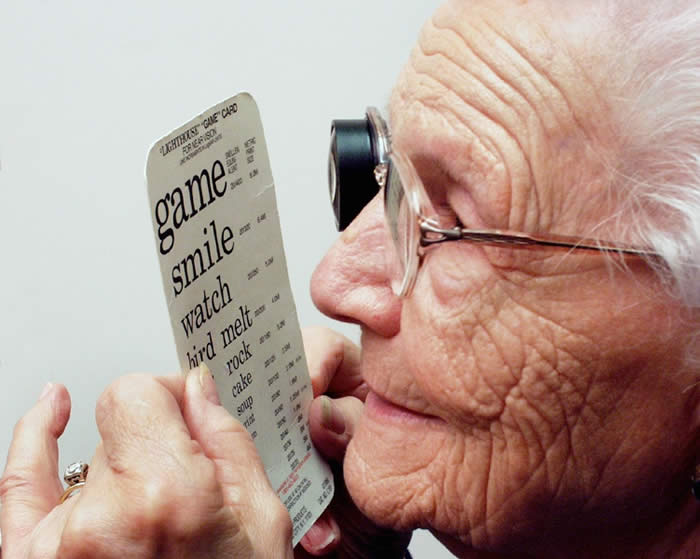
Special reading charts- Log MAR with single letter and continuous ones are used for recording near
vision.
These chart serve two purposes-
1. They record near visual acuity
2. They serve as visual base for calculation of the power of low vision.
3. These charts also have large size words with very low near visual acuity
A patient with low vision will prefer to hold the book closer than 33cm to read fluently.
Basically because the size of the retinal image increases as the print is brought closer.
The main purpose of recording vision with these charts is to calculate the diopter value required
for magnification for that particular patient. Which has been discussed earlier.
Refraction:
The basic step of retinoscopy has to be performed using any method. If media is not clear retinoscopy is
done at closer distance may be 25cm or 50cm. If so this type of retinoscopy is referred as radial
retinoscopy. Some guidelines while dealing with low vision patients are as follows:
1. Phoropters are not advisable.
2. The system of trial lenses and trial frames works better as the patients with defective fields can
use eccentric head or eye positions to read the chart. Still better are the large aperture full
frame trial lenses set.
3. Retinoscopy is important as subjective evaluation is usually not dependable.
4. Objective reading help a great deal and avoid wastage of time in subjective assessment. The
retinoscopy may not be extensive and small cylindrical errors prescriptions may better be
avoided.
5. Auto –refraction is also a useful guide.
FUNCTION TESTS:
A comprehensive low vision evaluation includes following three additional visual function tests modified
specially for low vision-
Amsler grid test
The scotoma density,position and the degree of distortion affect the ability print. For example,
dense scotoma covering the central 10 degree requires higher magnification and is more
difficult to overcome than the same scotoma above or to the left fixation. There are some
patient may not see a scotoma in spite of the documented retinal disease.
Contrast sensitivity function:
The benefit of measuring the CSF for patients with low vision is that there may be
preferential loss at certain spatial frequencies.
High –frequency losses are associated with difficulties with tasks such as reading and
facial recognition and mid-frequency losses are associated with mobility difficulties.
Glare Test:
Some low vision patients suffer from glare most often seen in pathologies like albinism,
cataract, posterior capsule opacification , aniridia, corneal edema or opacities, glaucoma etc.
Glare signifies the need to add filters or contrast enhancers in distance glasses to improve their
distance vision.
Testing of glare disability can be done by following methods:
1. Some estimation can be made by patient’s complaints.
2. Measure patient’s visual acuity both with and without illumination in vision chart. A
reduction on illuminated chart suggests Glare problem.
3. Make the patient read the chart, while he or she is reading simulate a light source may
be by torch or retinoscopy light into eye. A reduction will indicate glare disability..
Color vision
A person’s color vision can be assessed by checking if differences in colour can be idenfied.
Collect different colored threads, material or objects like buttons spread the objects out in front of the
person on a plain table or mat. He can move as close as he wants to the objects . Ask him to
discriminate, match or sort out colors.
